UAE is a USD 400 Billion economy and has grown at a CAGR of 5.3% where in it was valued at USD 357 Billion in 2016, and it grew to USD 417 Billion in 2019. The average household consumption expenditure is estimated at approximately 38% of the GDP. UAE is one of the key destinations for Indian workforce; being the workplace for ~3.4 Million Indian NRIs. A CEPA (Comprehensive Economic Partnership Agreement) has been signed between India and UAE to increase the bilateral merchandise trade. It is envisaged that the bilateral trade between India and UAE shall reach $100 Billion by 2030.
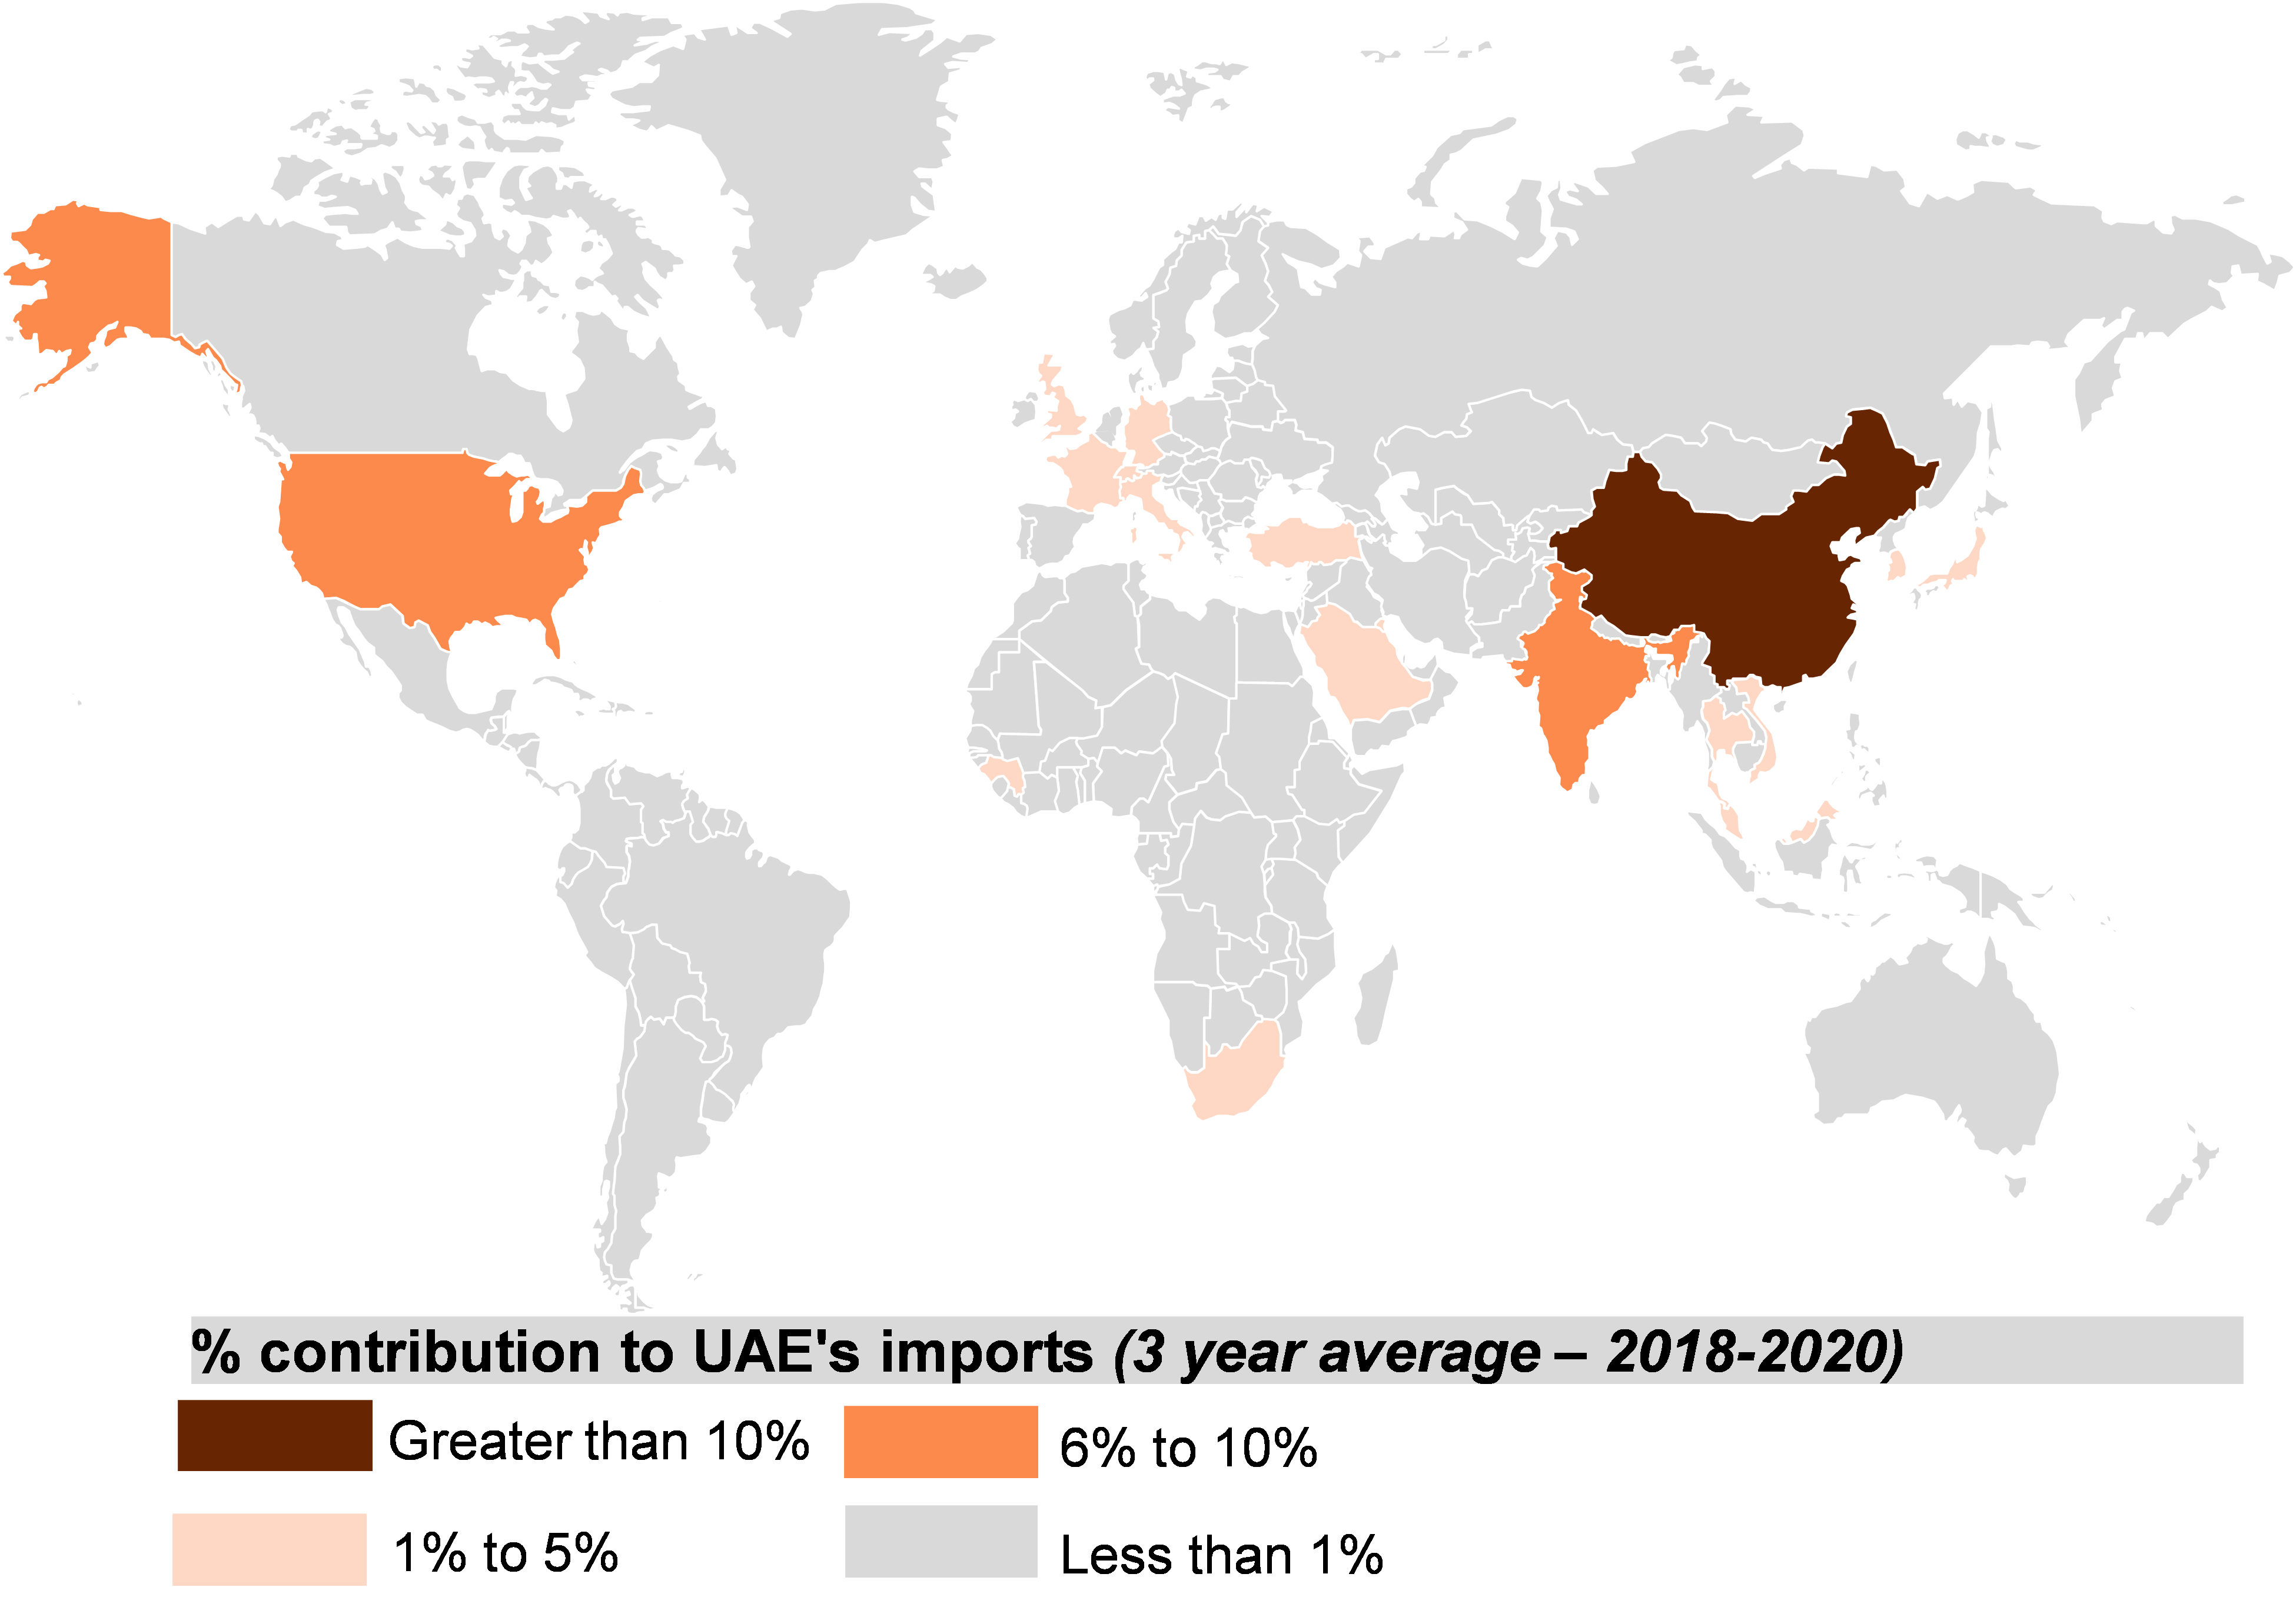
UAE is a USD 250 Bn import market, which is largely serviced by exporters from China, US and India. India is the third largest exporter to the United Arab with a share of around 9% of the total imports done by UAE. UAE’s imports have grown from USD 271 Billion in 2016 to USD 274 Billion in 2017. But that reduced to USD 270 Billion in 2019, and there was a further reduction 2020 to USD 249 due to the COVID situation and circumstances.
China contributes the highest to UAE’s import market at a contribution of 15%, followed by India. The top 10 countries contributing to 52% of the country’s imports apart from India and China are US, Japan, Germany, Saudi Arabia, Vietnam, Italy and France. A detailed list of key countries exporting to UAE is attached in annexure 01.
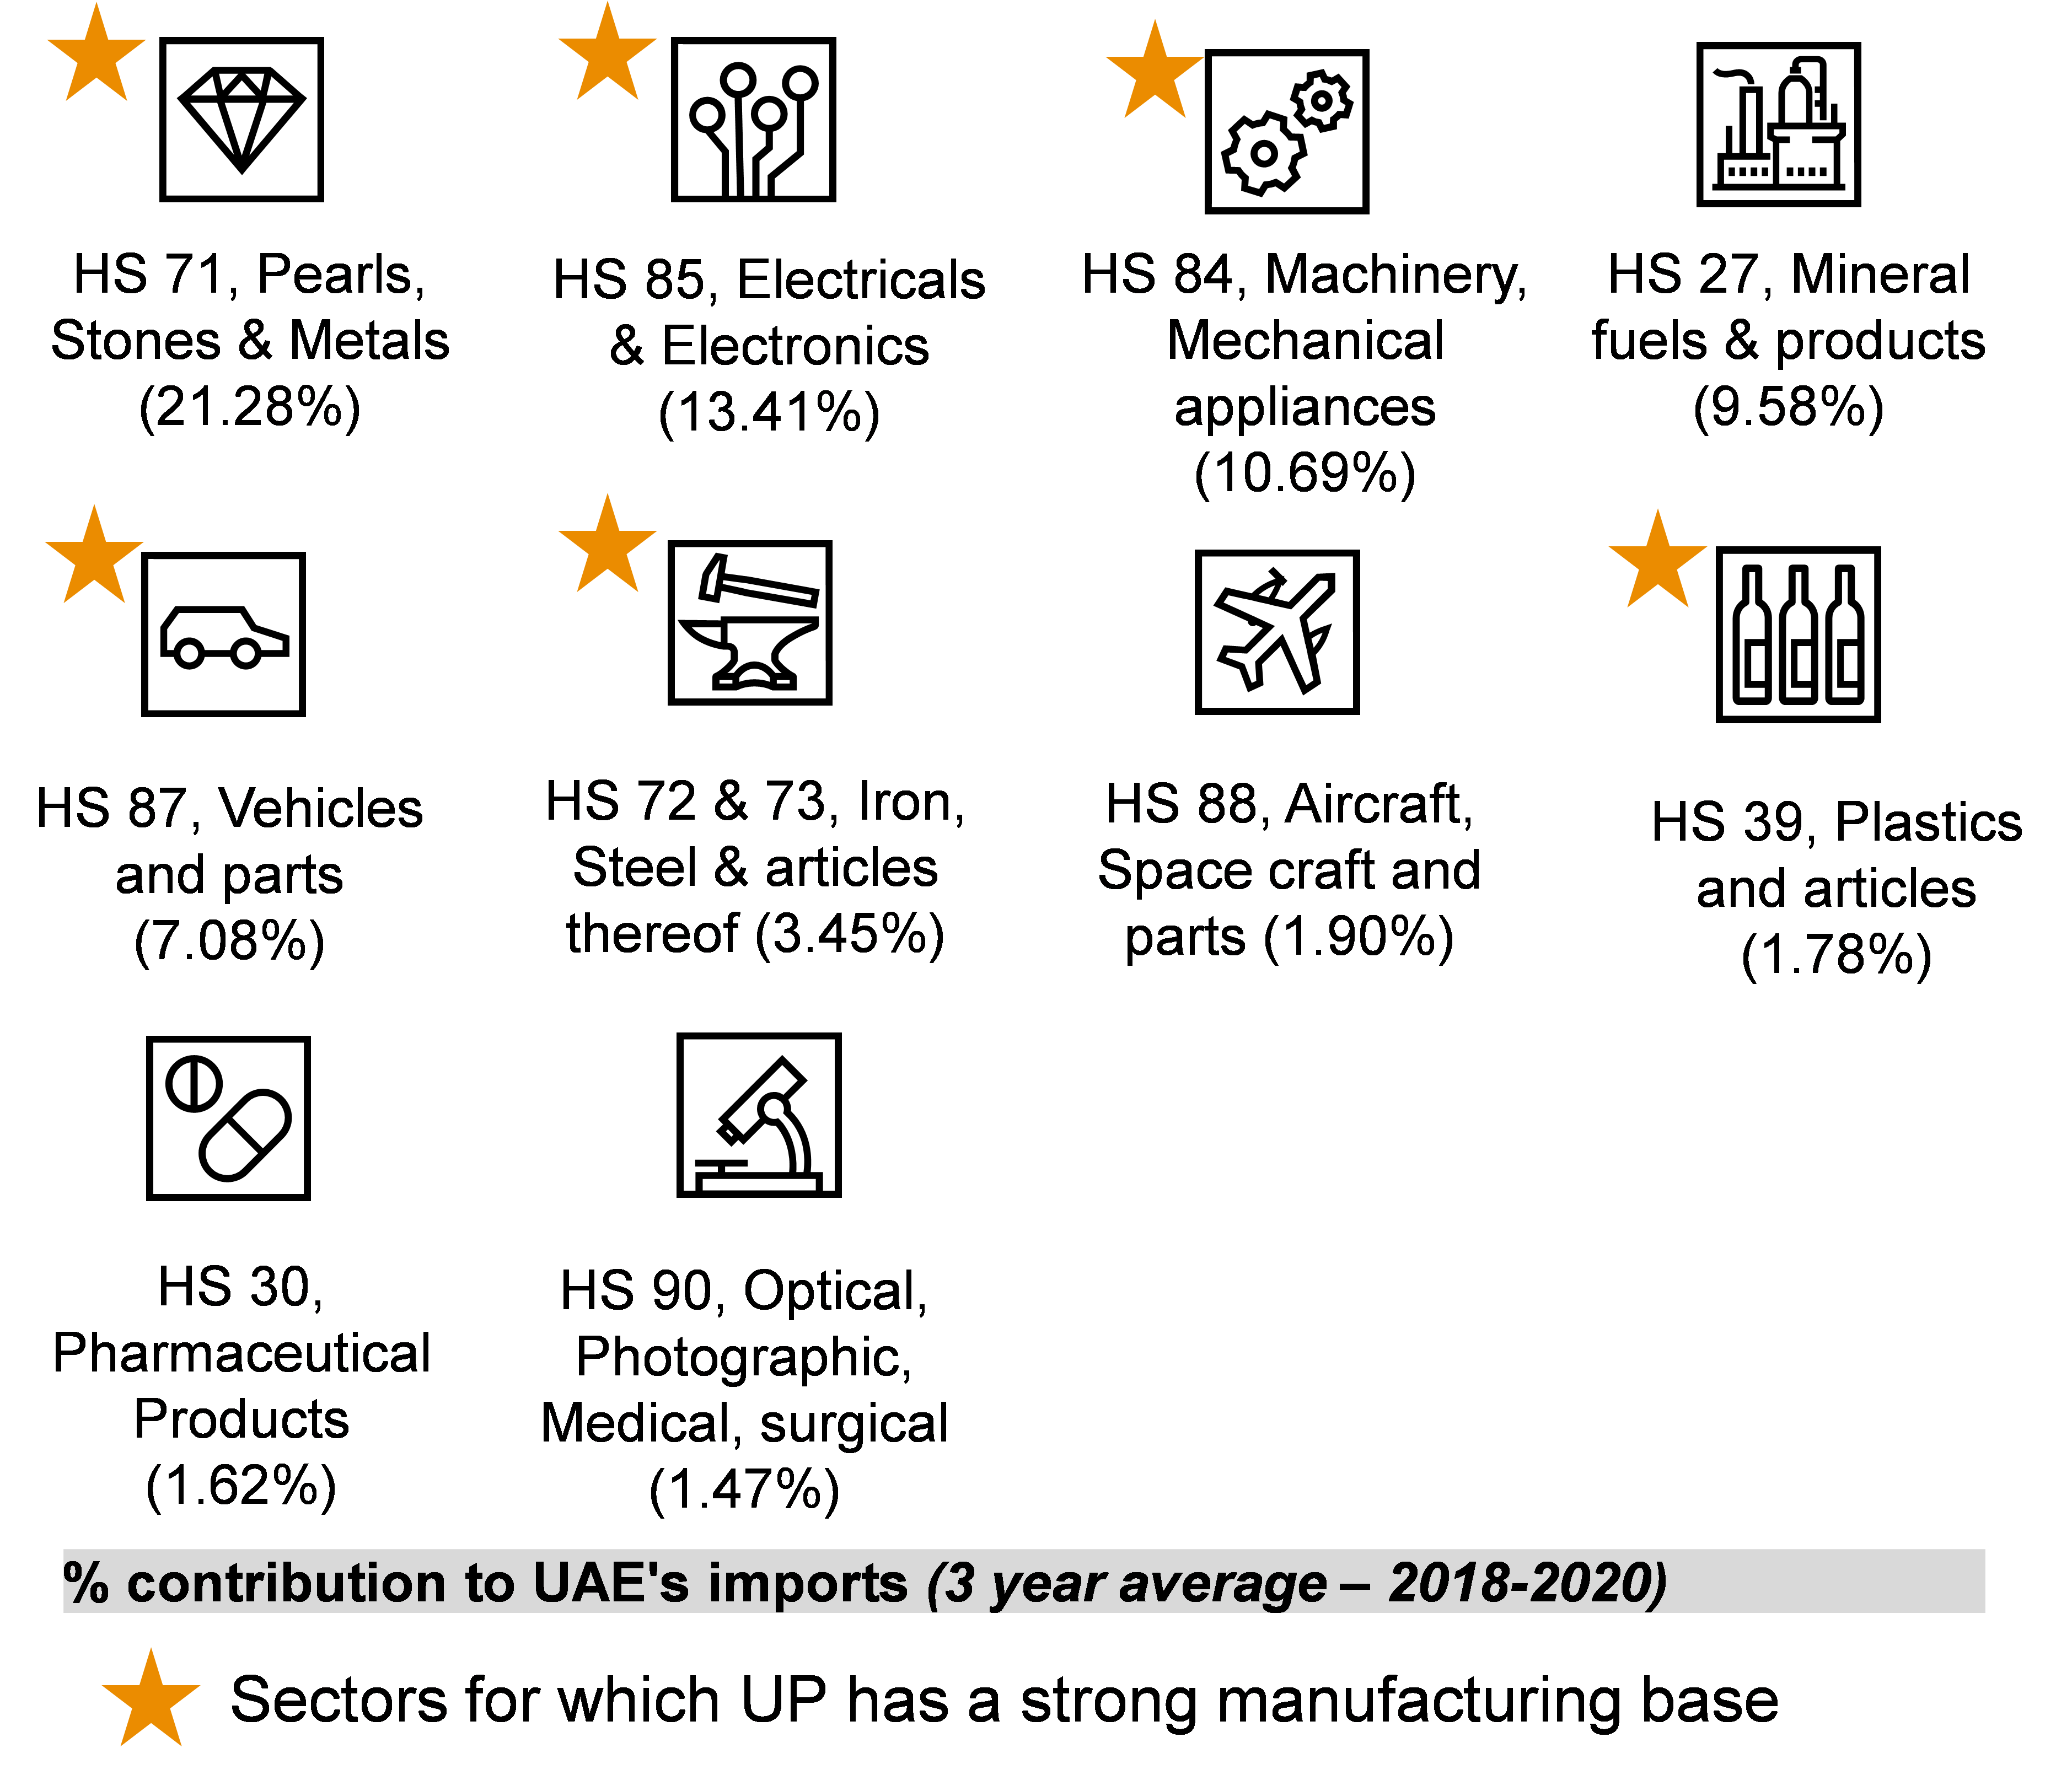
The leading sectors that contribute to 77% of UAE’s imports are Gems and Jewelry, Machinery & equipment, Electricals & electronics, Vehicles & auto-components, mineral fuels, pharmaceuticals, Plastics & its articles, Iron and Steel and Optical, photographic & Cinematographic devices. A detailed list of sectors is attached in Annexure 2
| HS Code | Service Label | Imported value in 2018 | Imported value in 2019 | Imported value in 2020 | 3 year average | % share |
|---|---|---|---|---|---|---|
| 'TOTAL | All Services | 107,464 | 107,311 | 124,139 | 112,971 | 100% |
| SOX1 | Memo item: Other commercial services | 38,532 | 38,067 | 38,230 | 38,276 | 34% |
| 4 | Travel | 17,645 | 17,999 | 33,383 | 23,009 | 20% |
| 5 | Construction | 2,451 | 2,614 | 2,696 | 2,587 | 2% |
| 8 | Charges for the use of intellectual property n.i.e | 2,587 | 2,777 | 2,886 | 2,750 | 2% |
| 9.2 | Computer services | 656 | 708 | 708 | 691 | 1% |
| 12 | Government goods and services n.i.e | 1,225 | 1,307 | 1,334 | 1,289 | 1% |
| 3.4 | Postal and courier services | 109 | 109 | 136 | 118 | 0% |
| 9.1 | Telecommunications services | 2,598 | 2,750 | 2,859 | 2,736 | 2% |
| 6 | Insurance and pension services | 27,366 | 26,140 | 26,794 | 26,767 | 24% |
| 3.2 | Air transport | 14,295 | 14,840 | 15,112 | 14,749 | 13% |
| 3.2 | Air transport | 14,295 | 14,840 | 15,112 | 14,749 | 13% |
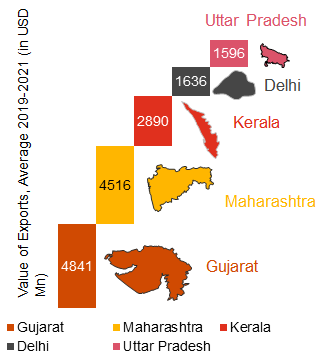
India exports an average of USD 22 Billion wort of products per year to UAE. India’s share in UAE’s imports have increased 6.89% from 2016 to 9.98% in 2019. Gujarat, Maharashtra, Kerala, Delhi, and Uttar Pradesh, are the top 5 states contributing approximately 69% of India’s exports to UAE. India exported around USD 18 Billion worth of exports in the last year itself.
India’s export market is largely characterized by top 10 sectors including, gems, and precious stones, Mineral fuels & oils, apparels, pharmaceuticals, articles of leathers, cereals, machinery, articles of iron and steels, textiles articles, electricals & electronics, footwear, road vehicles, etc. as shown in table below. The sector highlighted in yellow shows that those sectors are holding higher shares in world and brings in more revenue from UAE when compared to the rest of the world.
| Sector | India’s exports to UAE, (USD Mn) | % share of sector in India’s exports globally | % share of India’s exports to UAE’s imports |
|---|---|---|---|
| HS 71, Pearls, Stones, Metals | 7,626 | 10.98% | 41.75% |
| HS 27, Minerals & products | 5,354 | 13.10% | 12.77% |
| HS 85, Electricals & electronics | 1,870 | 4.36% | 10.01% |
| HS 72, Iron & Steel | 754 | 3.29% | 3.18% |
| HS 84, Machinery & equipment | 707 | 6.47% | 3.12% |
| HS 87, Vehicles & parts | 409 | 5.28% | 2.68% |
| HS 10, Cereals | 432 | 2.54% | 2.06% |
| HS 73, Articles of Iron & Steel | 402 | 2.23% | 1.87% |
| HS 61, Articles of apparel and clothing accessories, knitted | 1,038 | 2.34% | 1.81% |
| HS 39, Plastics and articles | 352 | 2.37% | 1.48% |
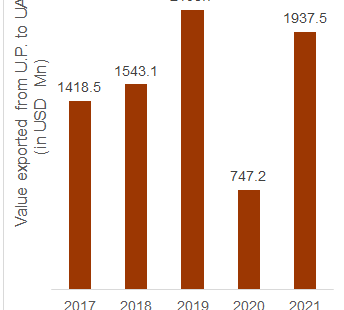
The exports from Uttar Pradesh to UAE grew at a CAGR of 9.14% in the last 5 years. Uttar Pradesh exported a total of USD 1,938 Million value of commodities to UAE in 2021. In 2020 the exports were valued at just USD 747 million but in the post COVID time it rebound with around 160% indicating that there is high growth potential in the UAE market
The top 11 sectors that contributes to approximately 91% of UP’s exports to UAE during the last 3 years. Export growth rate of 4 particular sectors in UAE is higher than the growth rate of UP’s exports in all markets, thus acting as the drivers of Uttar Pradesh’s export growth in UAE. The table below summarizes the top 11 sectors exported from UP to UAE:
| HS code | Product description | Value of Exports (in USD Mn) | % share in UP’s exports to UAE | Growth rate of exports from UP to UAE | Growth rate of exports from UP to all markets |
|---|---|---|---|---|---|
| 85 | Electrical machinery and equipment | 947.14 | 59.31% | -5.76% | 19.70% |
| 71 | Pearls, Stones/Metals, Articles | 195.85 | 12.26% | -24.37% | -39.78% |
| 61 & 62 | Articles of Apparels & Clothing | 102.25 | 6.40% | 12.16% | -7.49% |
| 02 | Meat and edible meat offal | 72.27 | 4.53% | 6.40% | -4.18% |
| 72 & 73 | Iron & Steel, Articles | 23.31 | 1.46% | 59.97% | 42.21% |
| 84 | Nuclear Reactor, Machinery & equipment | 22.75 | 1.42% | 18.44% | 18.78% |
| 17 | Sugars and Sugar Confectionery | 19.98 | 1.25% | 8185.19% | 117.45% |
| 76 | Aluminum & articles thereof | 19.19 | 1.20% | -10.08% | 17.08% |
| 10 | Cereals | 18.98 | 1.19% | 15.92% | 91.99% |
| 64 | Footwear, Gaiters, & parts | 18.23 | 1.14% | -2.04% | -10.45% |
| 48 | Paper and Paperboard, Articles of Paper Pulp, of paper | 14.29 | 0.90% | 20.65% | 24.36% |
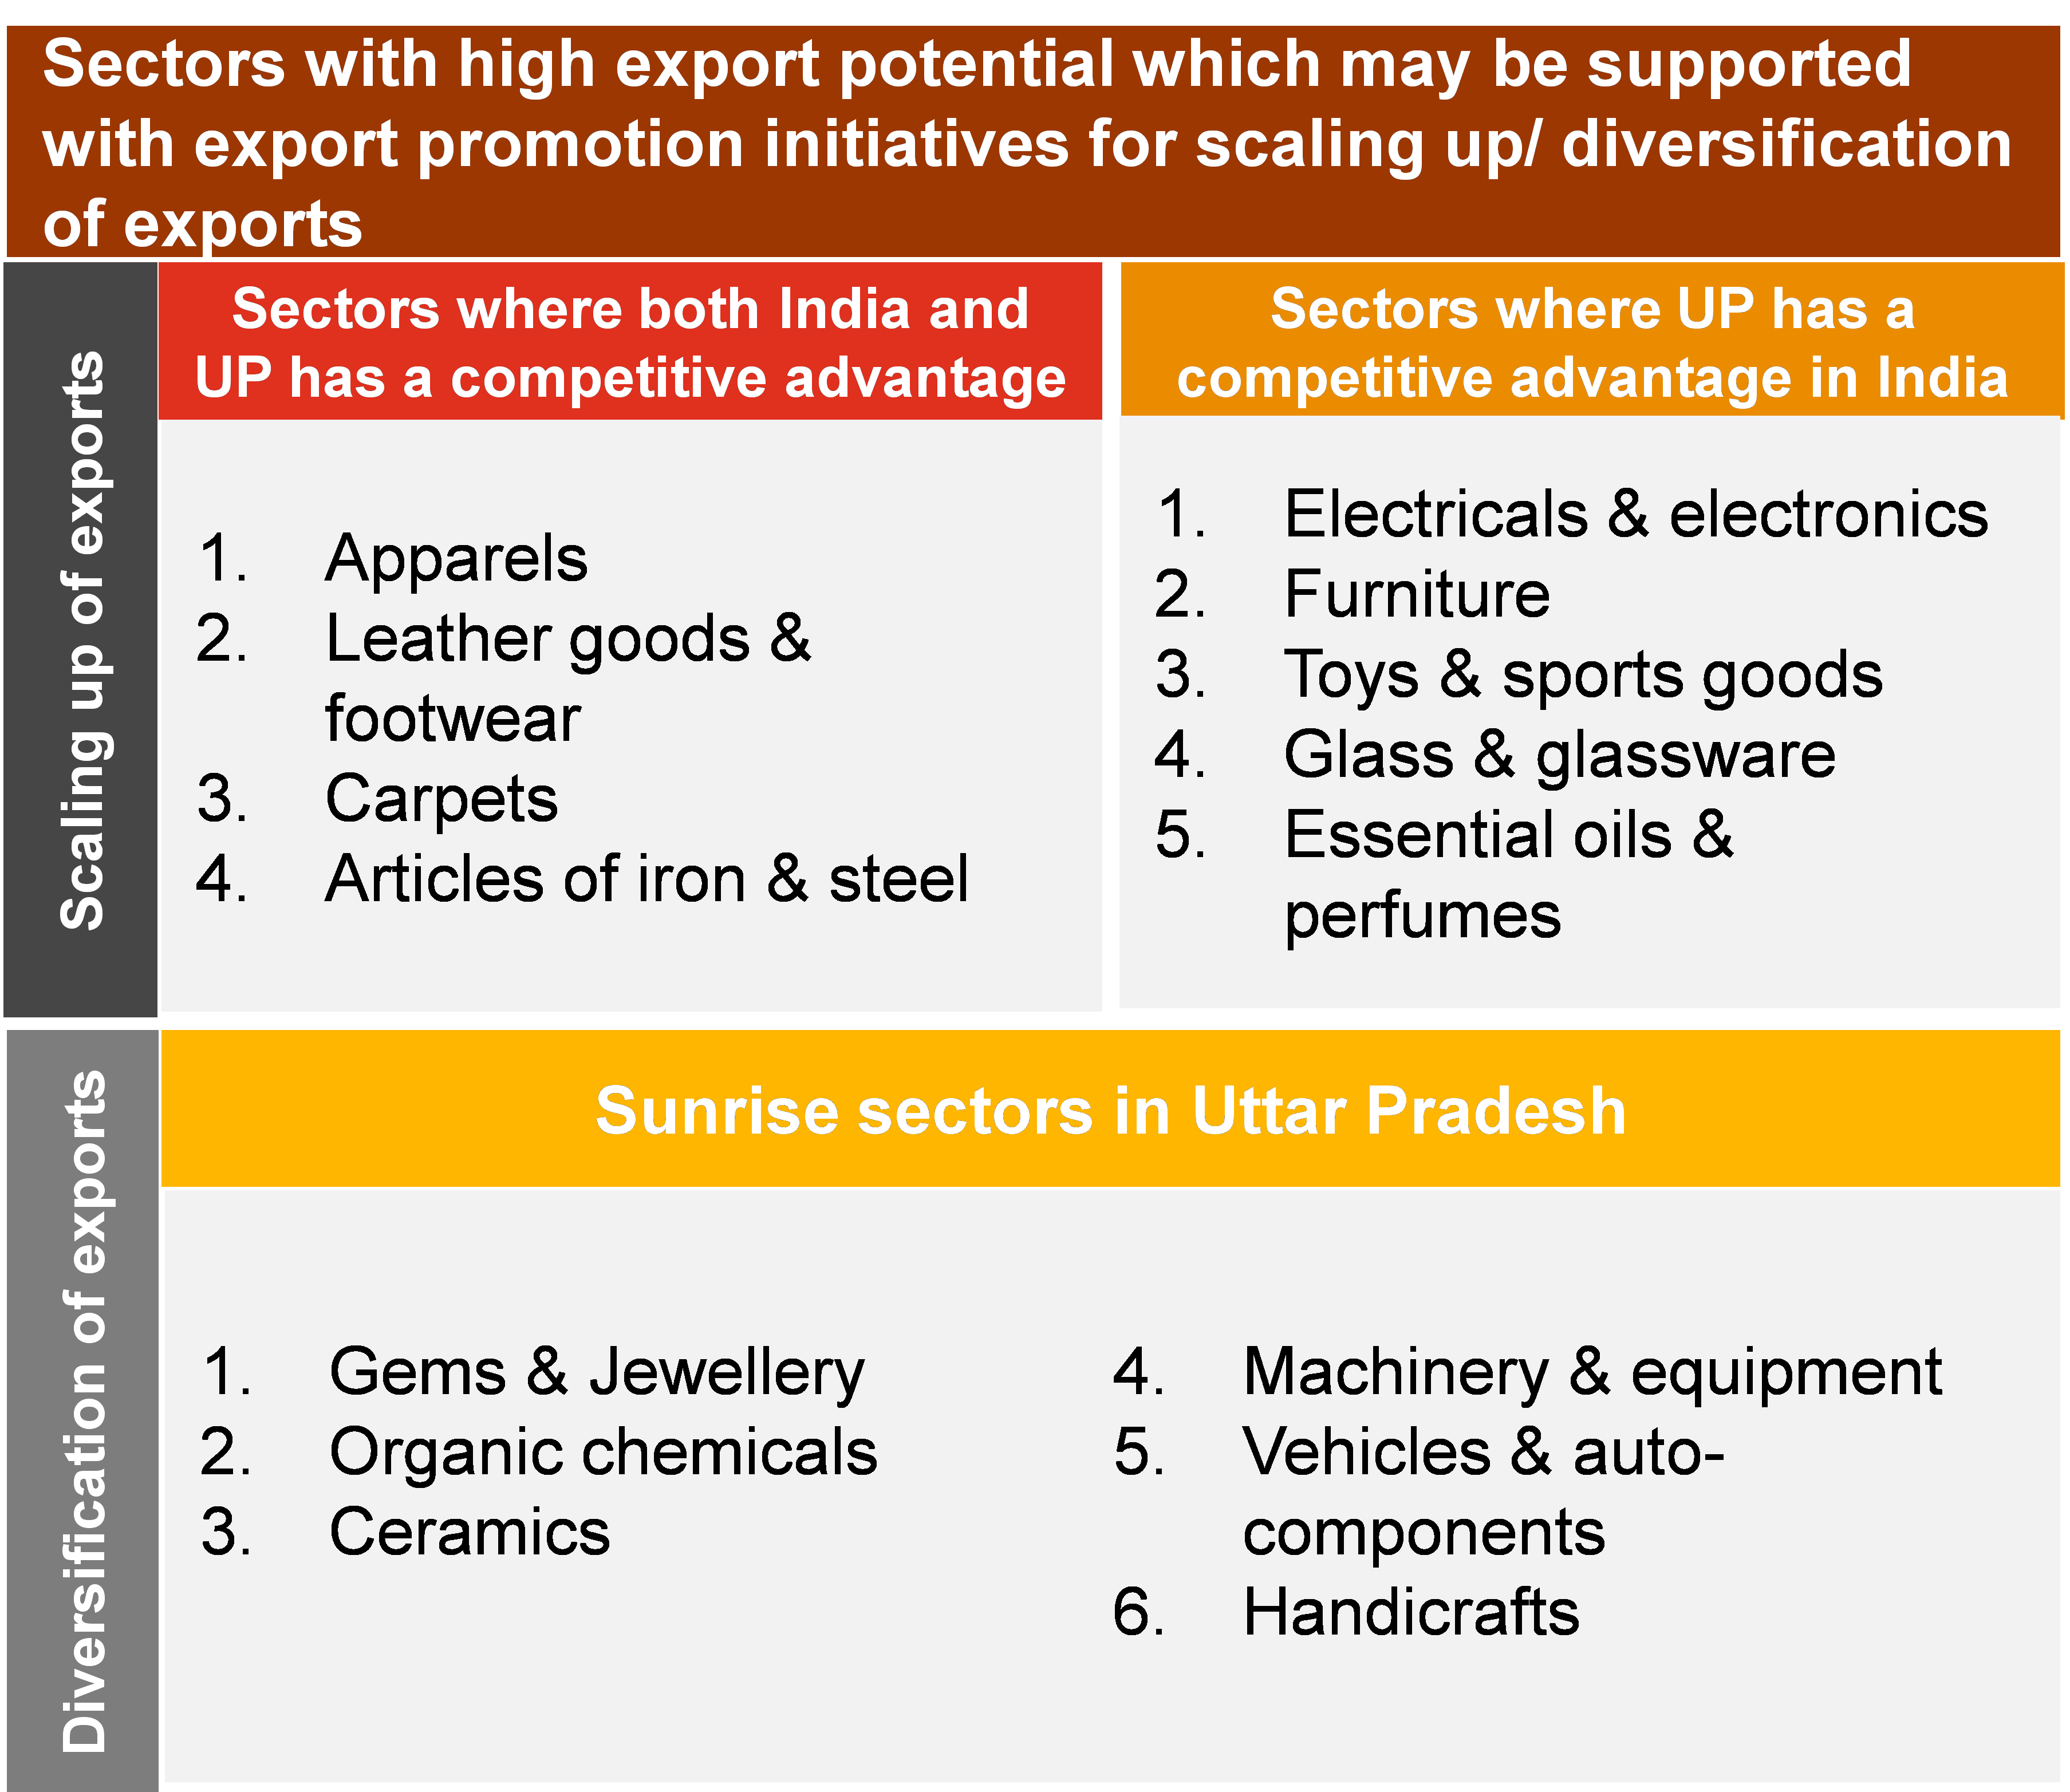
Priority sectors are identified for the exporters of Uttar Pradesh for either scaling up of exports or market diversification. The sectors are identified based on their import demand in UAE, India’s exports to UAE and UP’s exports to UAE. The priority sectors shortlisted are classified into two categories, based on the relevant strategy for export promotion. The sectors with significant manufacturing and exports volume to UAE are strategically selected for scaling up of exports. The sectors with appreciable manufacturing volume, but low level of exports from UP to UAE are selected for market diversification.
The table below summarizes the top 10 sectors shortlisted for UP’s exporters to venture into. A comprehensive detail for the select 10 sectors at a HS 6 level is described in annexure 3. Potential sectors for driving UP’s exports growth in UAE HS Code Product Description Value imported by UAE (USD Mn) Exports from India to UAE (USD Mn) UP’s exports to UAE (USD Mn) Potential intervention strategy 71 pearls, stones, metals clad ... 55065 9221 301.45 Scaling up 84 Machinery, nuclear reactors, boilers; parts thereof 27966 690 18.38 Scaling up 85 Electricals and electronics 34714 1865 825 Scaling up 87 Vehicles & auto-components 18309 591 17.08 Scaling up 72 & 73 Iron and Steels, Articles 8935 1115 17.23 Scaling up 42 & 64 Leather goods and footwear 2919 180.2 25.4 Scaling up 39 Plastics and articles thereof 4616 327 8.86 Diversification 30 Pharmaceutical products 4188 206 2.01 Diversification 94 Furniture 2265 41.2 5.56 Scaling up The India-UAE CEPA may potentially create opportunities for scaling up of trade between India and UAE. Uttar Pradesh’s export capabilities resonates with consumer demands in UAE. The Government of Uttar Pradesh has shortlisted products with a high export potential for each district of the state under the ‘Districts as Export Hubs’ initiative. Further, to support exporters of the state in scaling of exports, the government of Uttar Pradesh through Export Promotion Bureau – Uttar Pradesh and Uttar Pradesh Export Promotion Council has planned to undertake the following initiatives: 1. Identifying and connecting with Sectoral bodies (for priority sectors) based in Australia 2. Identifying importers and their sourcing needs 3. List of key events where UP's exporters shall participate 4. Facilitate visit of Australian Importers to UP in key trade events that may be organized by Government of Uttar Pradesh 5. Identification of online platforms where UP's exporters should register for exporting their products to meet sourcing requirements of Australian importers
| HS Code | Product Description | Value imported by UAE (USD Mn) | Exports from India to UAE (USD Mn) | UP’s exports to UAE (USD Mn) | Potential intervention strategy |
|---|---|---|---|---|---|
| 71 | Pearls, Stones, Metals Clad | 55065 | 9221 | 301.45 | Scaling up |
| 84 | Machinery, nuclear reactors, boilers; parts thereof | 27966 | 690 | 18.38 | Scaling up |
| 85 | Electricals and Electronics | 34714 | 1865 | 825 | Scaling up |
| 87 | Vehicles & Auto-Components | 18309 | 591 | 17.08 | Scaling up |
| 72 & 73 | Plastics and its Articles | 8935 | 1115 | 17.23 | Scaling up |
| 42 & 64 | Leather goods and Footwear | 2919 | 180.2 | 25.4 | Scaling up |
| 39 | Plastics and Articles thereof | 4616 | 327 | 8.86 | Diversification |
| 30 | Pharmaceutical Products | 4188 | 206 | 2.01 | Diversification |
| 30 | Pharmaceutical Products | 4188 | 206 | 2.01 | Diversification |
| 94 | Furniture | 2265 | 41.2 | 5.56 | Scaling up |
| Exporters | Imported value in 2018 | Imported value in 2019 | Imported value in 2020 | 3 year average | % share |
|---|---|---|---|---|---|
| Total | 261,511 | 267,937 | 246,880 | 258,776 | 100% |
| China | 38,012 | 40,778 | 39,373 | 39,388 | 15% |
| Area Nes | 16,935 | 18,911 | 31,721 | 22,522 | 9% |
| India | 23,067 | 26,735 | 16,469 | 22,091 | 9% |
| United States of America | 20,920 | 20,014 | 16,511 | 19,148 | 7% |
| Japan | 13,808 | 12,614 | 9,456 | 11,959 | 5% |
| Germany | 10,941 | 10,074 | 8,620 | 9,878 | 4% |
| Saudi Arabia | 7,577 | 6,845 | 6,476 | 6,966 | 3% |
| United Kingdom | 7,690 | 7,288 | 5,851 | 6,943 | 3% |
| Viet Nam | 7,666 | 7,194 | 5,852 | 6,904 | 3% |
| Italy | 6,654 | 6,562 | 5,543 | 6,253 | 2% |
| France | 6,509 | 6,764 | 4,762 | 6,012 | 2% |
| Korea, Republic of | 5,562 | 3,840 | 4,085 | 4,496 | 2% |
| Switzerland | 5,842 | 4,112 | 3,028 | 4,327 | 2% |
| Guinea | 2,302 | 2,381 | 6,833 | 3,838 | 1% |
| Bahrain | 3,273 | 4,286 | 2,471 | 3,343 | 1% |
| Turkey | 3,449 | 3,536 | 3,041 | 3,342 | 1% |
| Thailand | 3,354 | 3,420 | 3,011 | 3,262 | 1% |
| South Africa | 2,887 | 2,779 | 3,692 | 3,119 | 1% |
| Belgium | 3,108 | 2,690 | 2,284 | 2,694 | 1% |
| Malaysia | 2,919 | 2,779 | 2,140 | 2,613 | 1% |
| Others | 69,038 | 74,336 | 65,662 | 69,679 | 21% |
| HS Code | Product Description | Imported value in 2018 | Imported value in 2019 | Imported value in 2020 | 3 year average | % share |
|---|---|---|---|---|---|---|
| 'TOTAL | All products | 261,511 | 267,937 | 246,880 | 258,776 | 100% |
| '71 | Natural or cultured pearls, precious or semi-precious stones, precious metals, metals clad with precious metal, and articles thereof; imitation jewellery; coin | 54,153 | 58,579 | 52,464 | 55,066 | 21% |
| '27 | Mineral fuels, mineral oils and products of their distillation; bituminous substances; mineral waxes | 15,427 | 16,469 | 42,449 | 24,782 | 10% |
| '85 | Electrical machinery and equipment and parts thereof; sound recorders and reproducers, television image and sound recorders and reproducers, and parts and accessories of such articles | 34,227 | 36,721 | 33,194 | 34,714 | 13% |
| '84 | Machinery, mechanical appliances, nuclear reactors, boilers; parts thereof | 28,606 | 28,138 | 27,154 | 27,966 | 11% |
| '87 | Vehicles other than railway or tramway rolling stock, and parts and accessories thereof | 20,462 | 19,229 | 15,236 | 18,309 | 7% |
| '30 | Pharmaceutical products | 4,038 | 4,080 | 4,446 | 4,188 | 2% |
| '39 | Plastics and articles thereof | 4,879 | 4,730 | 4,240 | 4,616 | 2% |
| '90 | Optical, photographic, cinematographic, measuring, checking, precision, medical or surgical instruments and apparatus; parts and accessories thereof | 3,534 | 4,109 | 3,796 | 3,813 | 1% |
| '73 | Articles of iron or steel | 5,390 | 4,449 | 3,789 | 4,543 | 2% |
| '72 | Iron and steel | 5,219 | 4,311 | 3,648 | 4,393 | 2% |
| '88 | Aircraft, spacecraft, and parts thereof | 6,970 | 4,630 | 3,152 | 4,918 | 2% |
| '74 | Copper and articles thereof | 3,273 | 3,102 | 2,825 | 3,067 | 1% |
| '33 | Essential oils and resinoids; perfumery, cosmetic or toilet preparations | 3,188 | 3,183 | 2,545 | 2,972 | 1% |
| '94 | Furniture; bedding, mattresses, mattress supports, cushions and similar stuffed furnishings; lamps and lighting fittings, not elsewhere specified or included; illuminated signs, illuminated nameplates and the like; prefabricated buildings | 2,343 | 2,404 | 2,048 | 2,265 | 1% |
| '08 | Edible fruit and nuts; peel of citrus fruit or melons | 1,957 | 2,363 | 1,958 | 2,093 | 1% |
| '61 | Articles of apparel and clothing accessories, knitted or crocheted | 2,431 | 2,344 | 1,869 | 2,215 | 1% |
| '02 | Meat and edible meat offal | 1,870 | 2,282 | 1,753 | 1,968 | 1% |
| '04 | Dairy produce; birds' eggs; natural honey; edible products of animal origin, not elsewhere specified or included | 1,851 | 1,726 | 1,747 | 1,775 | 1% |
| '38 | Miscellaneous chemical products | 1,402 | 1,518 | 1,726 | 1,548 | 1% |
| '62 | Articles of apparel and clothing accessories, not knitted or crocheted | 2,173 | 2,095 | 1,649 | 1,972 | 1% |
| '40 | Rubber and articles thereof | 1,716 | 1,835 | 1,572 | 1,708 | 1% |
| '29 | Organic chemicals | 1,671 | 1,749 | 1,461 | 1,627 | 1% |
| '64 | Footwear, gaiters and the like; parts of such articles | 1,836 | 2,012 | 1,444 | 1,764 | 1% |
| '28 | Inorganic chemicals; organic or inorganic compounds of precious metals, of rare-earth metals, of radioactive elements or of isotopes | 2,449 | 3,024 | 1,380 | 2,284 | 1% |
| '91 | Clocks and watches and parts thereof | 1,689 | 1,777 | 1,336 | 1,601 | 1% |
| '24 | Tobacco and manufactured tobacco substitutes | 1,525 | 1,200 | 1,283 | 1,336 | 1% |
| '48 | Paper and paperboard; articles of paper pulp, of paper or of paperboard | 1,512 | 1,493 | 1,282 | 1,429 | 1% |
| Others | 45,716 | 48,384 | 25,433 | 39,844 | 15% |
| HS Code (6 digit) | Product Description | Share in UAE import at the HS 2 level | Average share in global imports at HS2 level | Global exports by India | India’s share in global exports | Global exports by Uttar Pradesh |
|---|---|---|---|---|---|---|
| HS 71 – Gems and Jewelry | ||||||
| '710812 | Gold, incl. gold plated with platinum, unwrought, for non-monetary purposes (excluding gold in powder form) | 57.2% | 38.4% | 117.01 | 0.05% | 0 |
| '711319 | Articles of jewellery and parts thereof, of precious metal other than silver, whether or not plated or clad with precious metal (excluding articles > 100 years old) | 20.6% | 11.2% | 9884.7 | 10.77% | 373.8 |
| Total of 2 commodity | 77.8% | 10001.71 | 373.8 | |||
| Rest of the commodities under HS code 71 | 22.2% | 34615 | 416.2 | |||
| HS 84 – Machinery & Equipment | ||||||
| '847130 | Data-processing machines, automatic, portable, weighing <= 10 kg, consisting of at least a central processing unit, a keyboard and a display (excluding peripheral units) | 12.5% | 6.9% | 48.757 | 0.03% | 0.9 |
| '841112 | Turbojets of a thrust > 25 kN | 10.3% | 2.6% | 2967.2 | 6.15% | 1.74 |
| '841191 | Parts of turbojets or turbopropellers, n.e.s. | 5.6% | 3.2% | 109.68 | 0.22% | 0 |
| '847150 | Processing units for automatic data-processing machines, whether or not containing in the same housing one or two of the following types of unit: storage units, input units, output units (excluding those of heading 8471.41 or 8471.49 and excluding peripheral units) | 4.0% | 3.6% | 45 | 0.06% | 0.5 |
| '848180 | Appliances for pipes, boiler shells, tanks, vats or the like (excluding pressure-reducing valves, valves for the control of pneumatic power transmission, check "non-return" valves and safety or relief valves) used for printing by means of plates, cylinders and other printing components of heading 8442) | 3.8% | 2.4% | 806.4 | 1.53% | 15 |
| '843143 | Parts for boring or sinking machinery of subheading 8430.41 or 8430.49, n.e.s. | 2.5% | 0.4% | 163.62 | 1.46% | 2.5 |
| '844399 | Parts and accessories of printers, copying machines and facsimile machines, n.e.s. (excluding of printing machinery used for printing by means of plates, cylinders and other printing components of heading 8442) | 2.4% | 2.2% | 32.96 | 0.07% | 4.1 |
| '841199 | Parts of gas turbines, n.e.s. | 2.4% | 0.9% | 77.97 | 0.39% | 0.7 |
| '847170 | Storage units for automatic data-processing machines | 2.1% | 3.5% | 28.66 | 0.04% | 0.1 |
| '841510 | Window or wall air conditioning machines, self-contained or "split-system" | 1.9% | 0.7% | 44.57 | 0.26% | 3.55 |
| Total of top 10 commodities | 47.4% | 4324.8 | 29.09 | |||
| Rest of the commodities under HS code 84 | 52.6% | 19,947 | 629.73 | |||
| HS 85 – Electricals & electronics | ||||||
| '851712 | Telephones for cellular networks "mobile telephones" or for other wireless networks | 49.4% | 9.5% | 2496.42 | 0.9% | 1751 |
| '851762 | Machines for the reception, conversion and transmission or regeneration of voice, images or other data, incl. switching and routing apparatus (excluding telephone sets, telephones for cellular networks or for other wireless networks) | 8.0% | 5.8% | 568.49 | 0.4% | 4.8 |
| '852580 | Television cameras, digital cameras and video camera recorders | 2.5% | 1.3% | 69.89 | 0.2% | 11.8 |
| '852872 | Reception apparatus for television, colour, whether or not incorporating radio-broadcast receivers or sound or video recording or reproducing apparatus, designed to incorporate a video display or screen | 2.5% | 1.5% | 7.31 | 0.0% | 0.66 |
| '851770 | Parts of telephone sets, telephones for cellular networks or for other wireless networks and of other apparatus for the transmission or reception of voice, images or other data, n.e.s. | 1.9% | 4.5% | 288.05 | 0.2% | 70.7 |
| '851830 | Headphones and earphones, whether or not combined with microphone, and sets consisting of a microphone and one or more loudspeakers (excluding telephone sets, hearing aids and helmets with built-in headphones, whether or not incorporating a microphone) aids and helmets with built-in headphones, whether or not incorporating a microphone) | 1.7% | 0.6% | 7.3 | 0.1% | 1.25 |
| Total of top 6 commodities | 66% | 3437.46 | 1840.21 | |||
| Rest of the commodities under HS code 85 | 34% | 13,393 | 2,413 | |||
| HS 87 - Vehicles & auto-mobiles | ||||||
| '870323 | Motor cars and other motor vehicles principally designed for the transport of persons, incl. station wagons and racing cars, with spark-ignition internal combustion reciprocating piston engine of a cylinder capacity > 1.500 cm³ but <= 3.000 cm³ (excluding vehicles for the transport of persons on snow and other specially designed vehicles of subheading 8703.10) | 33.8% | 18.4% | 1767.59 | 0.7% | 0.2 |
| '870324 | Motor cars and other motor vehicles principally designed for the transport of persons, incl. station wagons and racing cars, with spark-ignition internal combustion reciprocating piston engine of a cylinder capacity > 3.000 cm³ (excluding vehicles for the transport of persons on snow and other specially designed vehicles of subheading 8703.10) | 32.9% | 5.9% | 1.85 | 0.0% | 0 |
| Total of top 2 commodities | 66.8% | 1769.44 | 0.2 | |||
| Rest of the commodities under HS code 87 | 33.2% | 16,249 | 506.9 | |||
| HS 72 & 73 - Iron and Steels, Articles | ||||||
| '730890 | Structures and parts of structures, of iron or steel, n.e.s. (excluding bridges and bridge-sections, towers and lattice masts, doors and windows and their frames, thresholds for doors, props and similar equipment for scaffolding, shuttering, propping or pit-propping) | 16.4% | 11.2% | 482.87 | 1.3% | 13.36 |
| '720839 | Flat-rolled products of iron or non-alloy steel, of a width of >= 600 mm, in coils, simply hot-rolled, not clad, plated or coated, of a thickness of < 3 mm, not pickled, without patterns in relief | 6.1% | 4.1% | 1442.37 | 10.7% | 0.01 |
| '721420 | Bars and rods, of iron or non-alloy steel, with indentations, ribs, groves or other deformations produced during the rolling process | 6.4% | 16.0% | 731.42 | 1.7% | 331 |
| '720711 | Semi-finished products of iron or non-alloy steel containing, by weight, < 0,25% of carbon, of square or rectangular cross-section, the width measuring < twice the thickness | 6.0% | 2.0% | 13.17 | 0.3% | 0.003 |
| '720851 | Flat-rolled products of iron or non-alloy steel, of a width >= 600 mm, not in coils, simply hot-rolled, not clad, plated or coated, of a thickness of > 10 mm, without patterns in relief | 4.8% | 3.0% | 130.21 | 1.2% | 0 |
| '732690 | Articles of iron or steel, n.e.s. (excluding cast articles or articles of iron or steel wire) | 4.7% | 1.2% | 41.25 | 1.2% | 0.22 |
| '730429 | Casing and tubing, seamless, of iron or steel, of a kind used in drilling for oil or gas (excluding products of cast iron) | 4.5% | 2.1% | 397.79 | 5.4% | 0.01 |
| '730419 | Line pipe of a kind used for oil or gas pipelines, seamless, of iron or steel (excluding products of stainless steel or of cast iron) | 4.2% | 0.4% | 21.36 | 2.8% | 0.14 |
| '721049 | Flat-rolled products of iron or non-alloy steel, of a width of >= 600 mm, hot-rolled or cold-rolled ... | 4.1% | 2.7% | 214.97 | 2.3% | 0.04 |
| '720838 | Flat-rolled products of iron or non-alloy steel, of a width of >= 600 mm, in coils, simply hot-rolled, not clad, plated or coated, of a thickness of >= 3 mm but < 4,75 mm, not pickled, without patterns in relief | 3.6% | 1.7% | 188.48 | 3.7% | 0.26 |
| Total of top 10 commodities | 44.3% | 4178.06 | 344.84 | |||
| Rest of the commodities under HS code 72 & 73 | 55.7% | 16997 | 730.1 | |||
| HS 42 & 64 – Leather goods and footwear | ||||||
| '420221 | Handbags, whether or not with shoulder straps, incl. those without handles, with outer surface of leather, composition leather or patent leather | 11.5% | 20.2% | 375.44 | 2.5% | 45.5 |
| '640399 | Footwear with outer soles of rubber, plastics or composition leather, with uppers of leather (excluding covering the ankle, incorporating a protective metal toecap, sports footwear, orthopaedic footwear and toy footwear) | 10.2% | 20.5% | 284.58 | 1.1% | 107.8 |
| '640419 | Footwear with outer soles of rubber or plastics and uppers of textile materials (excluding sports footwear, incl. tennis shoes, basketball shoes, gym shoes, training shoes and the like, and toy footwear) | 9.7% | 16.4% | 73.1 | 0.3% | 8.73 |
| '640411 | Sports footwear, incl. tennis shoes, basketball shoes, gym shoes, training shoes and the like, with outer soles of rubber or plastics and uppers of textile materials Sports footwear, incl. tennis shoes, basketball shoes, gym shoes, training shoes and the like, |
9.5% | 13.5% | 148.1 | 1.0% | 4.5 |
| '640299 | Footwear with outer soles and uppers of rubber or plastics (excluding covering the ankle or with upper straps or thongs assembled to the sole by means of plugs, waterproof footwear of heading 6401, sports footwear, orthopaedic footwear and toy footwear) | 8.4% | 14.3% | 110.9 | 0.5% | 14.4 |
| '420222 | Handbags, whether or not with shoulder straps, incl. those without handles, with outer surface of plastic sheeting or textile materials | 7.1% | 13.6% | 304.4 | 2.3% | 36.2 |
| '640359 | Footwear with outer soles and uppers of leather (excluding covering the ankle, incorporating a protective metal toecap, with uppers which consist of leather straps across the instep and around the big toe, sports footwear, orthopaedic footwear and toy footwear) | 6.5% | 3.1% | 40.41 | 0.9% | 19.16 |
| '420292 | Travelling-bags, insulated food or beverage bags, toilet bags, rucksacks, shopping-bags, map-cases, tool bags, sports bags, jewellery boxes, cutlery cases, binocular cases, camera cases, musical instrument cases, gun cases, holsters and similar containers, with outer surface of plastic sheeting or textile materials (excluding trunks, briefcases, school satchels and similar containers, handbags and articles carried in the pocket or handbag) | 5.3% | 23.1% | 10.9 | 0.1% | 4.2 |
| Total of top 4 commodities | 68.2% | 1,347.83 | 240.5 | |||
| Rest of the commodities under HS code 42 & 64 | 31.8% | 4,814 | 1,184 | |||
| HS 39 – Plastics and articles | ||||||
| '390110 | Polyethylene with a specific gravity of < 0,94, in primary forms | 6.2% | 4.1% | 537.3817 | 2.2% | 3.9 |
| '390120 | Polyethylene with a specific gravity of >= 0,94, in primary forms | 6.2% | 4.7% | 403.3193 | 1.4% | 43.14 |
| '390410 | Poly"vinyl chloride", in primary forms, not mixed with any other substances | 5.0% | 1.9% | 17.55233 | 0.2% | 0.02 |
| '390140 | Ethylene-alpha-olefins copolymers, having a specific gravity of < 0,94 , in primary forms | 5.4% | 2.3% | 66.565 | 0.5% | 1 |
| '390210 | Polypropylene, in primary forms | 3.7% | 4.2% | 696.6387 | 2.7% | 0.1 |
| '390720 | Polyethers, in primary forms (excluding polyacetals and goods of 3002 10) | 3.7% | 2.0% | 57.255 | 0.4% | 0.33 |
| '391990 | Self-adhesive plates, sheets, film, foil, tape, strip and other flat shapes, of plastics, whether or not in rolls > 20 cm wide (excluding floor, wall and ceiling coverings of heading 3918) | 3.1% | 2.4% | 74.50867 | 0.5% | 4.35 |
| '390690 | Acrylic polymers, in primary forms (excluding poly"methyl methacrylate") | 2.9% | 2.4% | 98.25467 | 0.7% | 0.83 |
| '390761 | Poly"ethylene terephthalate", in primary forms, having a viscosity number of >= 78 ml/g | 3.9% | 1.3% | 789.213 | 8.6% | 0.08 |
| Total of top 10 commodities | 48.4% | 3290.1 | 74.75 | |||
| Rest of the commodities under HS code 39 | 61.6% | 7,259 | 271 | |||
| HS 30- Pharmaceuticals | ||||||
| '300490 | Medicaments consisting of mixed or unmixed products for therapeutic or prophylactic purposes, put up in measured doses "incl. those in the form of transdermal administration" or in forms or packings for retail sale (excluding medicaments containing antibiotics, medicaments containing hormones or steroids used as hormones, but not containing antibiotics, medicaments containing alkaloids or derivatives thereof but not containing hormones or antibiotics and medicaments containing provitamins, vitamins or derivatives thereof used as vitamins) | 61.1% | 48.6% | 12410.94 | 4.2% | 65.76 |
| '300215 | Immunological products, put up in measured doses or in forms or packings for retail sale | 10.9% | 15.6% | 127.89 | 0.1% | 0.03 |
| Total of top 2 commodities | 72% | 12538.83 | 65.79 | |||
| Rest of the commodities under HS code 30 | 38% | 16,277 | 135 | |||
| HS 94 – Furnitures | ||||||
| '940540 | Electric lamps and lighting fittings, n.e.s. | 14.8% | 7.3% | 33.88 | 0.1% | 3.26 |
| '940360 | Wooden furniture (excluding for offices, kitchens and bedrooms, and seats) | 11.3% | 10.4% | 540.27 | 2.1% | 40 |
| '940161 | Upholstered seats, with wooden frames (excluding convertible into beds) | 8.9% | 7.6% | 17.21 | 0.1% | 0.22 |
| '940510 | Chandeliers and other electric ceiling or wall lighting fittings (excluding for lighting public open spaces or thoroughfares) | 8.1% | 6.7% | 53.54 | 0.3% | 21 |
| '940350 | Wooden furniture for bedrooms (excluding seats) | 7.3% | 4.7% | 12.34 | 0.1% | 0.19 |
| '940320 | Metal furniture (excluding for offices, seats and medical, surgical, dental or veterinary furniture) | 7.2% | 7.1% | 133.61 | 0.8% | 20.2 |
| '940490 | Articles of bedding and similar furnishing, fitted with springs or stuffed or internally filled with any material or of cellular rubber or plastics (excluding mattress supports, mattresses, sleeping bags, pneumatic or water mattresses and pillows, blankets and covers) | 4.7% | 4.3% | 462.34 | 4.0% | 106.5 |
| '940390 | Parts of furniture, n.e.s. (excluding of seats and medical, surgical, dental or veterinary furniture) | 6.0% | 5.8% | 30.14 | 0.2% | 7 |
| Total of top 8 commodities | 68.3% | 1283.33 | 198.37 | |||
| Rest of the commodities under HS code 88 | 31.2% | 1,773 | 294.1 | |||
| HS 28 – Inorganic chemicals | ||||||
| '281820 | Aluminium oxide (excluding artificial corundum) | 69% | 11.6% | 515.23 | 3.6% | 0.003 |
| Total of top commodity | 69% | 515.23 | 0.003 | |||
| Rest of the commodities under HS code 28 | 31% | 1,822 | 18.7 | |||
